Hands-On Lab: Distribution of Superluminal Velocities in Quasars#
In certain radio-loud quasars, astronomers observe apparent superluminal motion. I.e., jet components that appear to move faster than light in the plane of the sky. This effect is explained by relativistic beaming plus light-travel-time*geometry, not an actual violation of relativity. In this lab, you will:
Model a population of quasar jets launched at speed \(\beta c\) in random directions.
Compute each jet’s apparent transverse velocity \(\beta' \equiv v'/c\).
Compare your empirical distribution of \(\beta'\) with a known theoretical result.
Estimate mean values and build confidence intervals, tying in concepts from parameter estimation.
Explore possible bias if only jets above some detection threshold are “observed”.
This exercise demonstrates how random orientation plus relativistic speeds yield “superluminal” expansions in a statistical sample, and how the distribution is theoretically predictable.
Physical Recap#
A quasar jet moving at speed \(v\) at an angle \(\theta\) to our line of sight can show apparent velocity:
Note that although a \(v/c\) term appears in this expression, the effect is not a relativistic effect. It is just due to light delay and the viewing geometry. Let \(\beta = v/c\) and \(\beta' = v'/c\),
Note that the apparent transverse speed \(\beta'\) has a maximum value when
Hence, \(\beta = \cos\theta\) at maximum. Define \(\gamma = (1 - \beta^2)^{-1/2}\), we have \(1/\gamma = \sin\theta\) at the maximum. Therefore,
where \(\gamma\) can be much larger than unity.
Distribution#
Given a randomly oriented sample of radio sources, what is the distribution of \(\beta'\) if \(\beta\) is fixed?
In a random 3D orientation scenario, we want uniform distribution over solid angle \(d\Omega = \sin\theta d\theta d\phi\). Integrate over \(dphi\), it is clear that
The range is chosen because in standard models, the nucleus always eject blobs in two opposite directions. And we are modeling the one blob that travels toward the observator.
Therefore,
In the limit \(\beta\to 1\), it is not to difficult to derive
import numpy as np
import matplotlib.pyplot as plt
def distgen(beta, N=10_000):

    gamma = 1 / np.sqrt(1 - beta * beta)

    # HANDSON: Random angles in [0, pi/2]: uniform in cos(theta)
    thetas = np.arccos(np.random.uniform(0.0, 1.0, size=N))

    # HANDSON: Compute apparent velocity
    sints  = np.sin(thetas)
    costs  = np.cos(thetas)
    betaps = (beta * sints) / (1.0 - beta * costs)
    #deltas = (1.0  / gamma) / (1.0 - beta * costs)

    return betaps #, deltas
# HANDSON: implement the superluminal motion equation
# and confirm the approximated distribution is good for `betap >= 1`.

def mkplot(ax, beta, N=10_000):
    #betaps, deltas = distgen(beta, N)
    betaps = distgen(beta, N)

    #betaps = betaps[deltas > 1]

    # HANDSON: Empirical histogram
    ax.hist(betaps, bins=200, density=True, alpha=0.5, label=r'$\beta$='+f'{beta:.3f}')

    # HANDSON: Print statistics
    avg_betap = np.mean(betaps)
    std_betap = np.std(betaps, ddof=1)
    print(f"Mean of beta': {avg_betap:.3f}, std: {std_betap:.3f}")
fig, ax = plt.subplots(1,1, figsize=(6,4))

# HANDSON: change beta and study the resulting distribution
mkplot(ax, beta=0.9)
mkplot(ax, beta=0.99)
mkplot(ax, beta=0.999)

# HANDSON: overplot the approximated distribution
betap  = np.linspace(0, 25, num=251)
pbetap = 4 * betap / (1 + betap*betap)**2
ax.plot(betap, pbetap, label='analytical')

ax.legend()
ax.set_ylabel(r"$p(\beta')$")
ax.set_xlabel(r"$\beta'$")
ax.set_xlim(0, 10)
ax.set_ylim(0, 1.5)
Mean of beta': 1.445, std: 0.374
Mean of beta': 2.169, std: 1.306
Mean of beta': 2.434, std: 2.199
(0.0, 1.5)

fig, ax = plt.subplots(1,1, figsize=(6,4))

# HANDSON: change beta and study the resulting distribution
mkplot(ax, beta=0.9)
mkplot(ax, beta=0.99)
mkplot(ax, beta=0.999)

# HANDSON: overplot the approximated distribution
betap  = np.linspace(0, 25, num=251)
pbetap = 4 * betap / (1 + betap*betap)**2
ax.plot(betap, pbetap, label='analytical')

ax.legend()
ax.set_ylabel(r"$p(\beta')$")
ax.set_xlabel(r"$\beta'$")
ax.set_xlim(0, 10)
ax.set_ylim(0, 1.5)
Mean of beta': 1.443, std: 0.372
Mean of beta': 2.155, std: 1.288
Mean of beta': 2.417, std: 2.146
(0.0, 1.5)
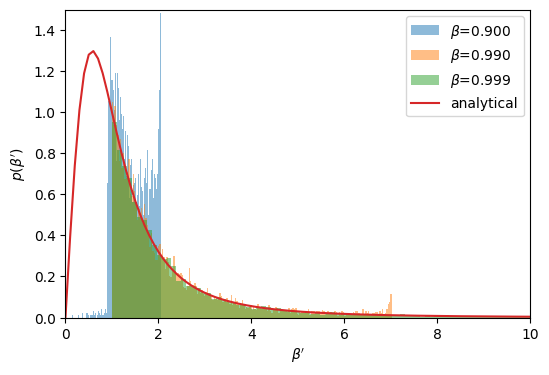
Interpretation
A significant fraction of \(\beta'\) may exceed 1, giving the illusion of faster than light motion.
Increasing \(\beta\) (closer to 1) pushes more of the distribution to higher \(\beta'\).